| Height: | 5-11 |
| Year: | Junior |
| Hometown: | East Hartford, Conn. |
| High School: | East Catholic |
| Position: | Forward |
| Major: | Computer Science |
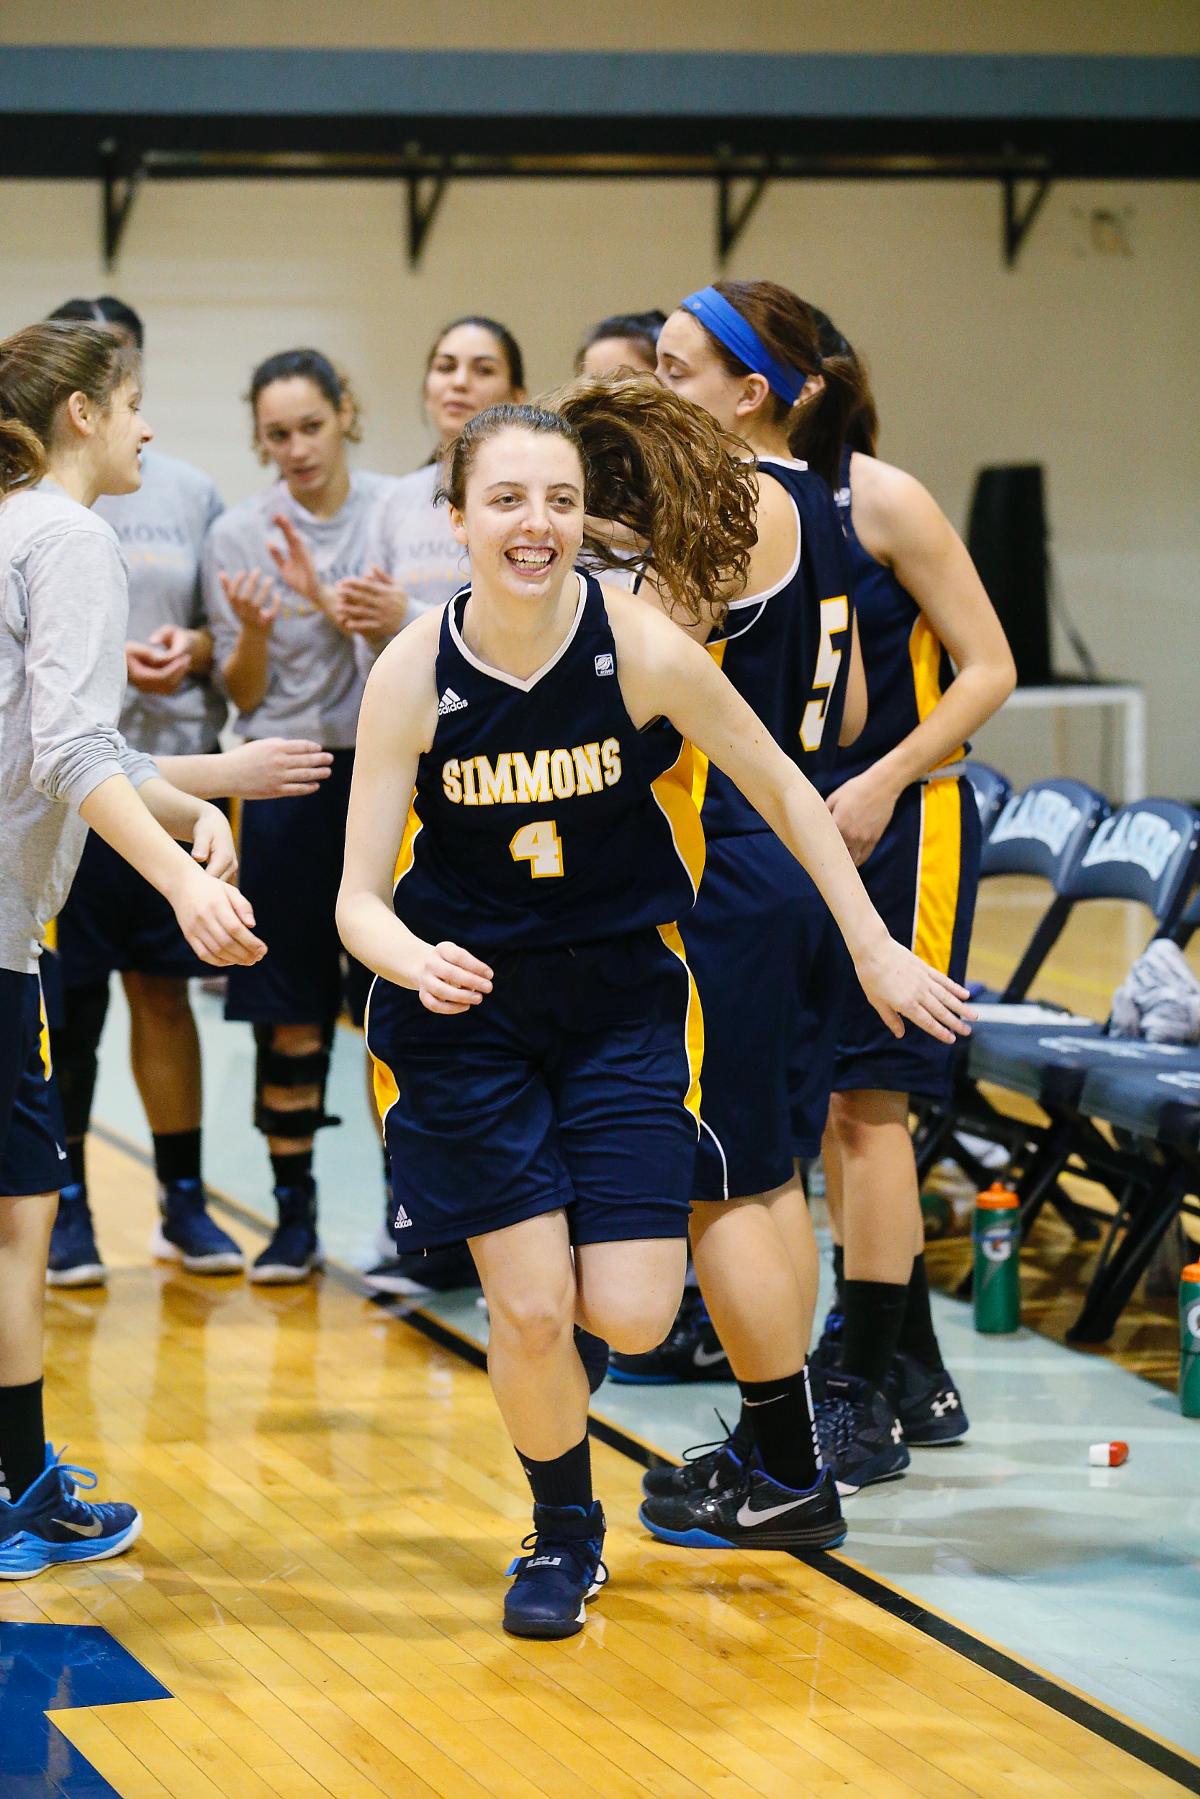
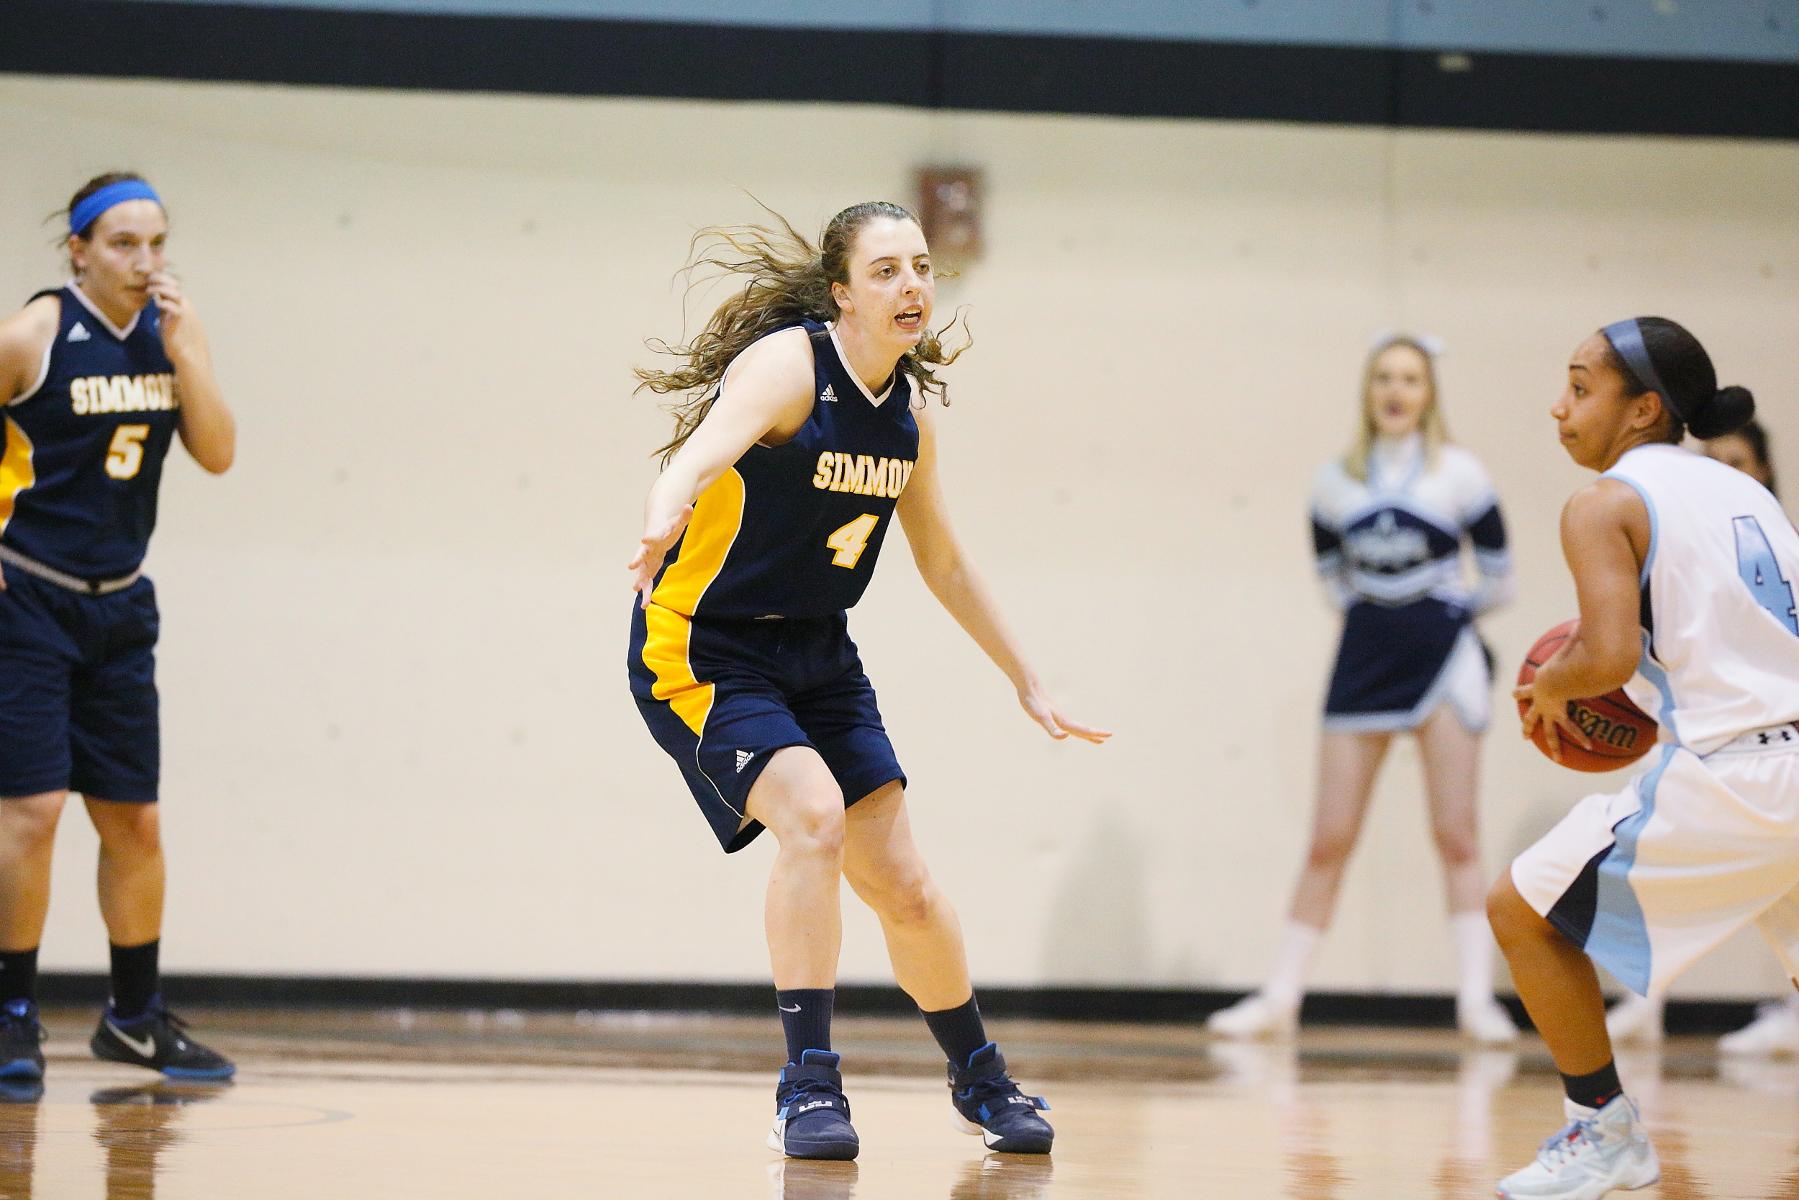
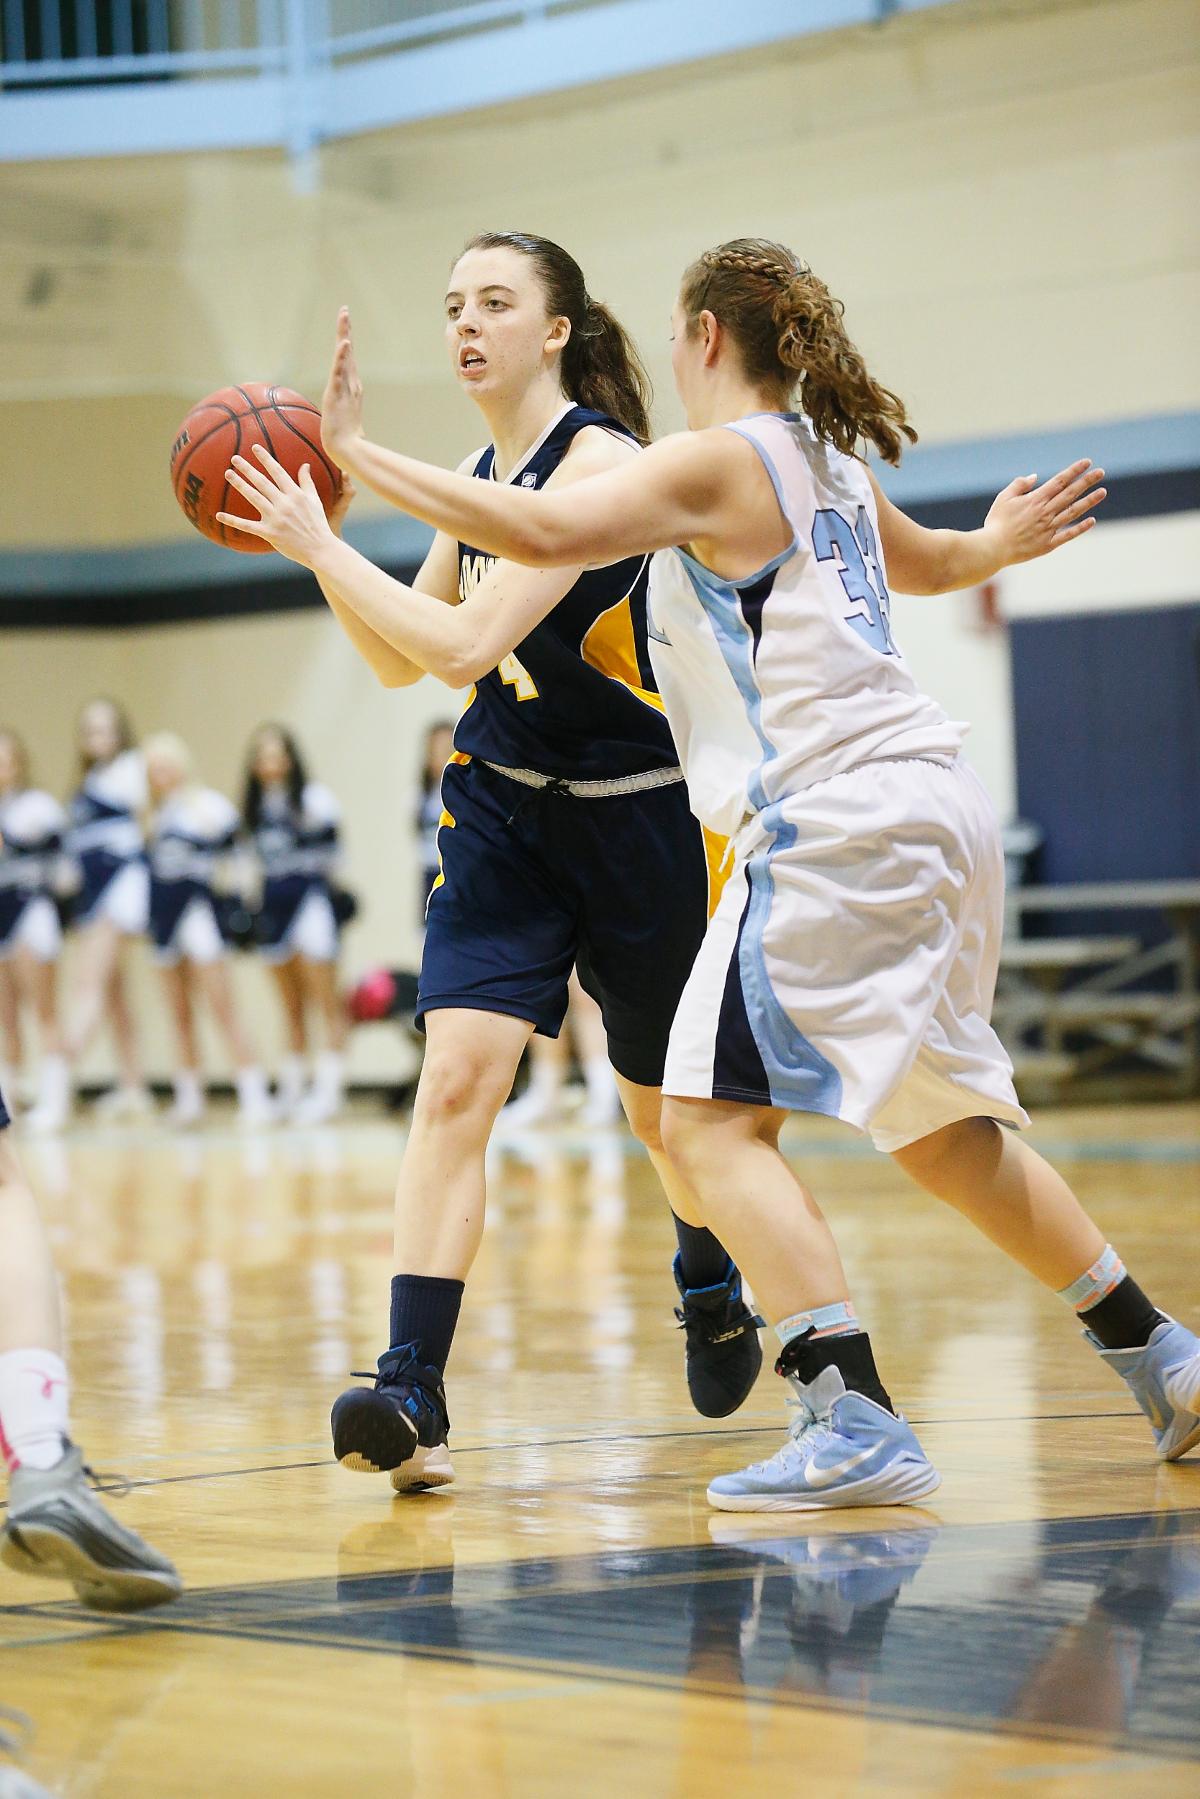
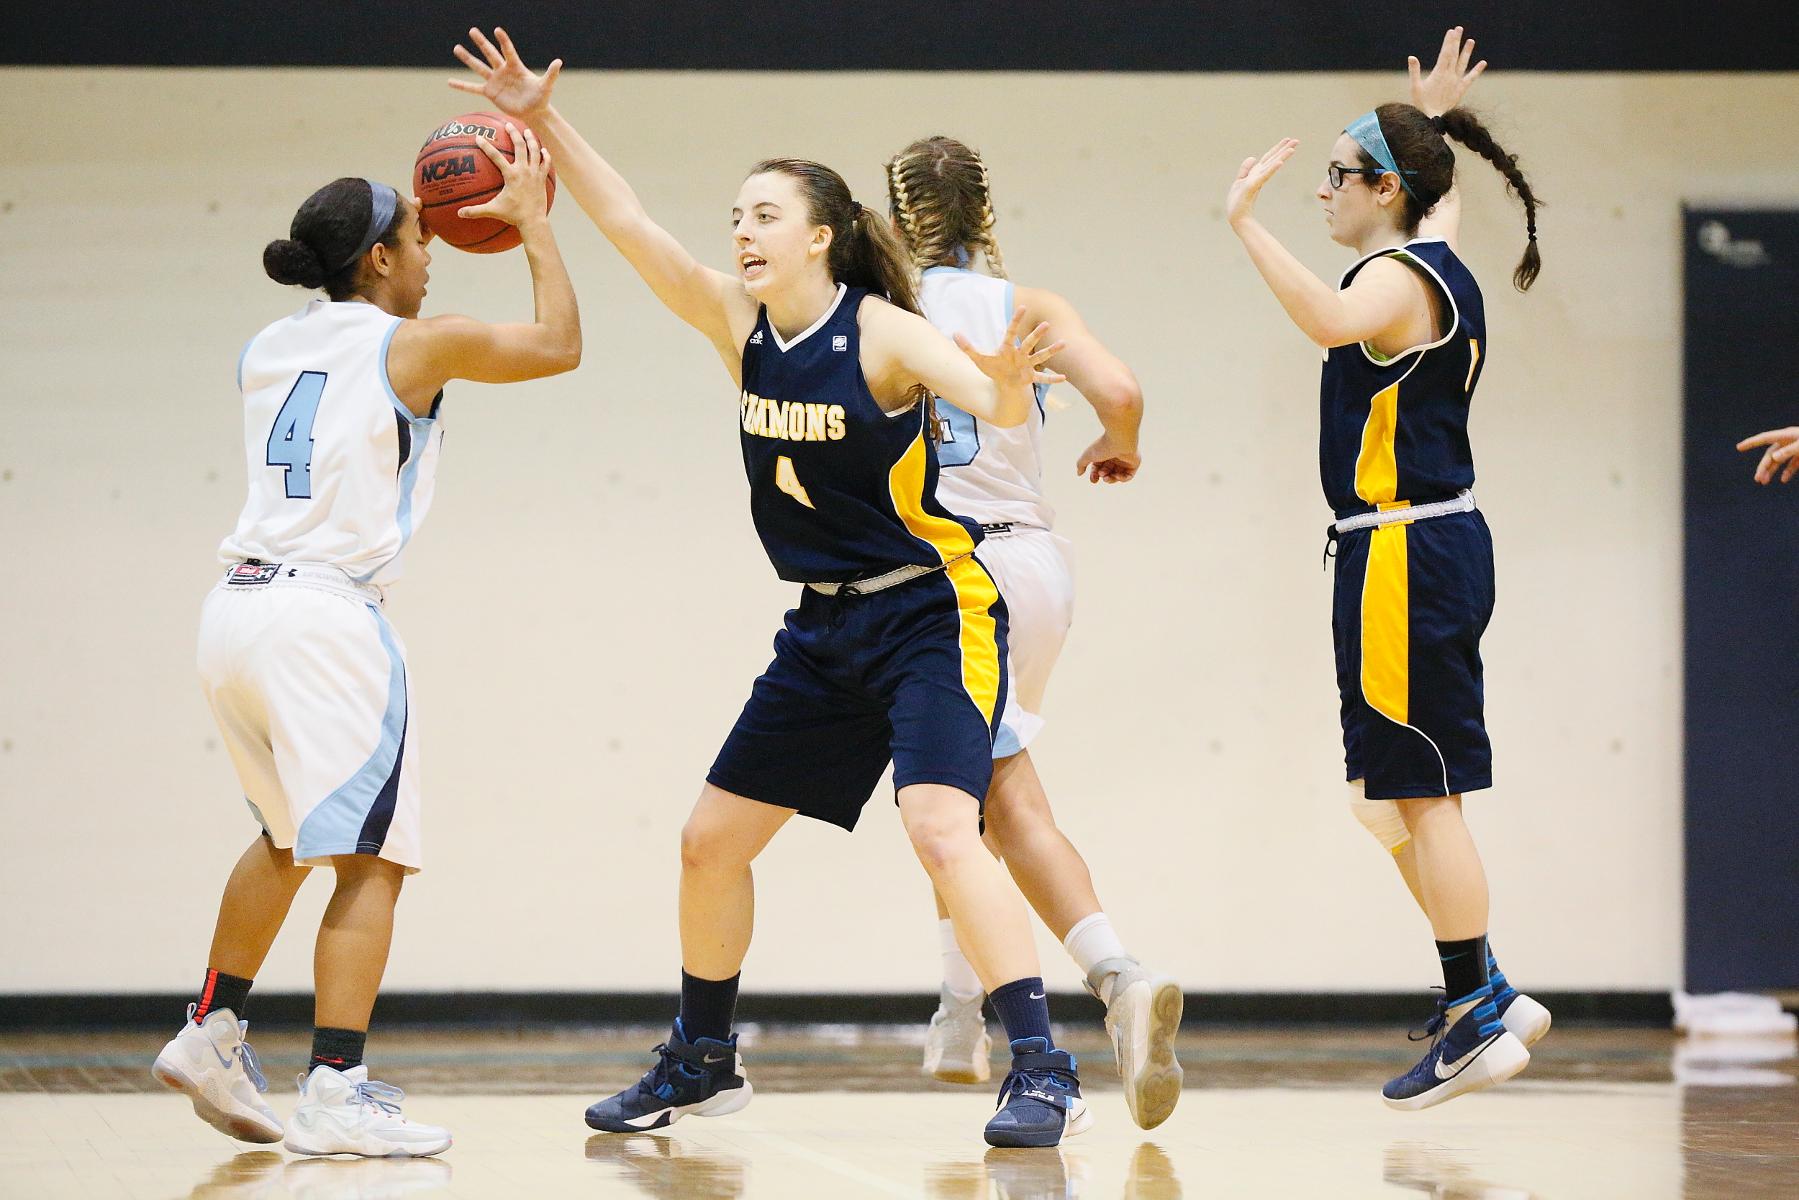
 2015-16 Season: Tabbed the Captain for the Sharks ... Started 18 of 25 games and averaged 6.4 points and 5.0 rebounds in 24.0 minutes per game ... Shot 73.2% (52-71) from the free throw line to place 11th among Great Northeast Athletic Conference leaders and ranked second on the team with 21 blocks ... Netted a season-high 12 points and was 4-8 from the floor, while adding five rebounds and four assists at Emmanuel College on February 13 ... Posted a double-double of 10 points and 11 rebounds in addition to four assists and a blocked shot at Anna Maria College on February 6 ... Recorded multiple blocks on seven occasions and rejected at least one shot in five straight games from January 5-14 ... Grabbed five or more rebounds in 12 contests ... Made 10 straight free throws from February 13-18.
2014-15 Season: Named a Captain ... Saw action in all 24 games and also made 21 starts ... Led the team with 7.5 rebounds per game and ranked 15th among Great Northeast Athletic Conference leaders ... Placed second on the squad with 10.8 points in 24.3 minutes per game ... Shot .735 (61-83) from the free throw line to rank 10th among qualifying shooters in the GNAC ... Stood second on the squad with 15 blocked shots and third with 17 steals ... Registered five double-doubles to lead the team and scored double-digits on 12 occasions ... Posted a double-double with season-highs of 20 points and 15 rebounds to go with two assists and a block at University of Saint Joseph (Conn.) on February 7 ... Averaged 18.5 points, 10.5 rebounds, 2.5 assists and 1.0 blocks per game, while shooting 56% (14-25) from the field and 90% (9-10) from the line in a two-game stretch vs. Lasell College on January 15 and at Albertus Magnus College on January 19 ... Averaged 9.8 rebounds per game in a five-game stretch from November 19 to December 9, while pulling down double-digits on three occasions ... Converted nine consecutive free throws from January 8-15 ... Closed out the season with at least one block in three straight games.
2013-14 Season: Led all Simmons rookies with 9.0 points per game and led the team with 6.3 rebounds per game, 11 total blocks and a 38.2% (76-199) field goal percentage ... Netted double-digits on nine occasions and posted three double-doubles ... Scored a season-high 20 points on 7-13 from the floor and a perfect 6-6 from the free throw line to go with nine rebounds, two assists and three steals in 26 minutes ... Scored 12 points, grabbed 12 boards and blocked a season-high three shots at Lasell College on February 8.
High School/Personal: Four-year letterwinner in basketball and soccer for East Catholic High School ... Named to the Connecticut Interscholastic Athletic All-Conference team for basketball and soccer as a senior for the Eagles ... Landed a spot on the CIAC Academic All-Conference squad ... Earned the CIAC Sportsmanship Award for ECHS ... Tabbed the Most Valuable Player for the East Catholic basketball and soccer squads ... Selected a Captain for the Eagles' basketball team as a senior ... Member of the National Honor Society for ECHS ... Earned an American History Award at East Catholic ...Volunteered at the Immaculate Conception Food Shelter and the South Park Inn Food Shelter ... Born July 15, 1995 ... Majoring in Computer Science with a minor in Business at Simmons ... Daughter of Ken and Maeve Brasa.
| Recent Games | ||
|---|---|---|
| Feb 6 | at Anna Maria | L, 69-56 |
| Feb 9 | at MIT | L, 72-40 |
| Feb 13 | at Emmanuel (Mass.) | L, 92-54 |
| Feb 16 | Saint Joseph's College of Maine | L, 75-49 |
| Feb 18 | at Clark University | L, 67-39 |
| Feb 20 | Johnson & Wales (RI) | L, 69-35 |
| Statistics category | Overall | Conf | ||
|---|---|---|---|---|
| Games | 25 | 11 | ||
| Games started | 18 | 11 | ||
| Minutes | 599 | 292 | ||
| Minutes per game | 24.0 | 26.5 | ||
| FG | 54-193 | 27-97 | ||
| FG Pct | 28.0 | 27.8 | ||
| 3PT | 0-7 | 0-2 | ||
| 3PT Pct | 0.0 | 0.0 | ||
| FT | 52-71 | 30-40 | ||
| FT Pct | 73.2 | 75.0 | ||
| Off rebounds | 37 | 13 | ||
| Def rebounds | 87 | 39 | ||
| Total rebounds | 124 | 52 | ||
| Rebounds per game | 5.0 | 4.7 | ||
| Personal fouls | 37 | 19 | ||
| Disqualifications | 0 | 0 | ||
| Assists | 32 | 19 | ||
| Turnovers | 54 | 27 | ||
| Assist to turnover ratio | 0.6 | 0.7 | ||
| Steals | 20 | 8 | ||
| Blocks | 21 | 5 | ||
| Points | 160 | 84 | ||
| Points per game | 6.4 | 7.6 | ||
| Points per 40 min | 10.7 | 11.5 | ||
| Date | Opponent | Score | gs | min | fg | pct | 3pt | pct | ft | pct | pts |
|---|---|---|---|---|---|---|---|---|---|---|---|
| Nov 14 | at Rensselaer | L, 80-40 | - | 18 | 2-8 | 25.0 | 0-0 | - | 0-0 | - | 4 |
| Nov 18 | at Wellesley | L, 43-35 | - | 25 | 3-8 | 37.5 | 0-1 | 0.0 | 0-0 | - | 6 |
| Nov 24 | Wheelock | W, 57-44 | - | 25 | 1-6 | 16.7 | 0-0 | - | 4-6 | 66.7 | 6 |
| Dec 1 | at Brandeis | L, 72-38 | - | 19 | 2-6 | 33.3 | 0-0 | - | 1-2 | 50.0 | 5 |
| Dec 3 | Fisher | W, 58-49 | - | 18 | 4-10 | 40.0 | 0-0 | - | 0-0 | - | 8 |
| Dec 5 | at MCLA | L, 53-43 | - | 15 | 0-3 | 0.0 | 0-0 | - | 1-2 | 50.0 | 1 |
| Dec 8 | at Lesley | W, 60-45 | - | 17 | 3-6 | 50.0 | 0-0 | - | 1-1 | 100.0 | 7 |
| Jan 2 | WPI | L, 59-46 | 1 | 34 | 2-8 | 25.0 | 0-0 | - | 2-4 | 50.0 | 6 |
| Jan 5 | Pine Manor | W, 68-65 | 1 | 29 | 2-10 | 20.0 | 0-0 | - | 2-2 | 100.0 | 6 |
| Jan 7 | Newbury | W, 68-42 | 1 | 22 | 2-4 | 50.0 | 0-0 | - | 2-2 | 100.0 | 6 |
| Jan 9 | Suffolk | L, 65-52 | 1 | 27 | 2-8 | 25.0 | 0-0 | - | 4-4 | 100.0 | 8 |
| Jan 12 | at Norwich | L, 65-44 | 1 | 22 | 1-6 | 16.7 | 0-0 | - | 2-3 | 66.7 | 4 |
| Jan 14 | Me.-Presque Isle | W, 70-43 | 1 | 13 | 0-4 | 0.0 | 0-2 | 0.0 | 0-0 | - | 0 |
| Jan 16 | at Rivier | L, 69-61 | 1 | 24 | 3-9 | 33.3 | 0-0 | - | 2-2 | 100.0 | 8 |
| Jan 18 | St. Joseph (Conn.) | W, 64-51 | 1 | 30 | 5-14 | 35.7 | 0-0 | - | 2-2 | 100.0 | 12 |
| Jan 23 | at Mount Ida | L, 61-55 | 1 | 30 | 4-15 | 26.7 | 0-0 | - | 2-2 | 100.0 | 10 |
| Jan 28 | at Lasell | L, 55-51 | 1 | 24 | 2-3 | 66.7 | 0-0 | - | 0-4 | 0.0 | 4 |
| Jan 30 | Albertus Magnus | L, 57-46 | 1 | 34 | 3-11 | 27.3 | 0-1 | 0.0 | 0-1 | 0.0 | 6 |
| Feb 2 | Emerson | L, 60-47 | 1 | 24 | 3-8 | 37.5 | 0-1 | 0.0 | 3-4 | 75.0 | 9 |
| Feb 6 | at Anna Maria | L, 69-56 | 1 | 28 | 1-10 | 10.0 | 0-1 | 0.0 | 8-10 | 80.0 | 10 |
| Feb 9 | at MIT | L, 72-40 | 1 | 26 | 2-9 | 22.2 | 0-0 | - | 3-4 | 75.0 | 7 |
| Feb 13 | at Emmanuel (Mass.) | L, 92-54 | 1 | 27 | 4-8 | 50.0 | 0-0 | - | 4-6 | 66.7 | 12 |
| Feb 16 | Saint Joseph's College of Maine | L, 75-49 | 1 | 26 | 1-8 | 12.5 | 0-0 | - | 4-4 | 100.0 | 6 |
| Feb 18 | at Clark University | L, 67-39 | 1 | 22 | 1-6 | 16.7 | 0-1 | 0.0 | 3-4 | 75.0 | 5 |
| Feb 20 | Johnson & Wales (RI) | L, 69-35 | 1 | 20 | 1-5 | 20.0 | 0-0 | - | 2-2 | 100.0 | 4 |
| Date | Opponent | Score | gs | min | off | def | reb | ast | to | a/to | stl | blk | pf | dq |
|---|---|---|---|---|---|---|---|---|---|---|---|---|---|---|
| Nov 14 | at Rensselaer | L, 80-40 | - | 18 | 2 | 3 | 5 | 0 | 3 | 0.0 | 0 | 2 | 1 | - |
| Nov 18 | at Wellesley | L, 43-35 | - | 25 | 4 | 2 | 6 | 0 | 1 | 0.0 | 0 | 1 | 2 | - |
| Nov 24 | Wheelock | W, 57-44 | - | 25 | 2 | 2 | 4 | 1 | 2 | 0.5 | 0 | 2 | 1 | - |
| Dec 1 | at Brandeis | L, 72-38 | - | 19 | 0 | 1 | 1 | 0 | 2 | 0.0 | 2 | 0 | 4 | - |
| Dec 3 | Fisher | W, 58-49 | - | 18 | 2 | 5 | 7 | 1 | 1 | 1.0 | 0 | 0 | 2 | - |
| Dec 5 | at MCLA | L, 53-43 | - | 15 | 2 | 2 | 4 | 0 | 1 | 0.0 | 1 | 2 | 3 | 0 |
| Dec 8 | at Lesley | W, 60-45 | - | 17 | 1 | 2 | 3 | 0 | 0 | - | 1 | 2 | 0 | - |
| Jan 2 | WPI | L, 59-46 | 1 | 34 | 0 | 6 | 6 | 4 | 1 | 4.0 | 2 | 0 | 2 | - |
| Jan 5 | Pine Manor | W, 68-65 | 1 | 29 | 2 | 10 | 12 | 1 | 5 | 0.2 | 0 | 2 | 2 | - |
| Jan 7 | Newbury | W, 68-42 | 1 | 22 | 0 | 3 | 3 | 2 | 1 | 2.0 | 0 | 1 | 0 | - |
| Jan 9 | Suffolk | L, 65-52 | 1 | 27 | 0 | 4 | 4 | 2 | 0 | - | 1 | 1 | 1 | - |
| Jan 12 | at Norwich | L, 65-44 | 1 | 22 | 2 | 4 | 6 | 0 | 3 | 0.0 | 2 | 1 | 1 | - |
| Jan 14 | Me.-Presque Isle | W, 70-43 | 1 | 13 | 2 | 7 | 9 | 2 | 3 | 0.7 | 1 | 2 | 0 | - |
| Jan 16 | at Rivier | L, 69-61 | 1 | 24 | 0 | 3 | 3 | 3 | 1 | 3.0 | 0 | 0 | 3 | - |
| Jan 18 | St. Joseph (Conn.) | W, 64-51 | 1 | 30 | 0 | 1 | 1 | 0 | 1 | 0.0 | 1 | 0 | 1 | - |
| Jan 23 | at Mount Ida | L, 61-55 | 1 | 30 | 0 | 6 | 6 | 3 | 2 | 1.5 | 2 | 1 | 1 | 0 |
| Jan 28 | at Lasell | L, 55-51 | 1 | 24 | 0 | 3 | 3 | 0 | 1 | 0.0 | 1 | 1 | 3 | - |
| Jan 30 | Albertus Magnus | L, 57-46 | 1 | 34 | 2 | 3 | 5 | 0 | 2 | 0.0 | 0 | 0 | 2 | 0 |
| Feb 2 | Emerson | L, 60-47 | 1 | 24 | 3 | 2 | 5 | 2 | 1 | 2.0 | 2 | 0 | 1 | - |
| Feb 6 | at Anna Maria | L, 69-56 | 1 | 28 | 5 | 6 | 11 | 4 | 4 | 1.0 | 0 | 1 | 2 | - |
| Feb 9 | at MIT | L, 72-40 | 1 | 26 | 2 | 2 | 4 | 0 | 3 | 0.0 | 2 | 0 | 0 | - |
| Feb 13 | at Emmanuel (Mass.) | L, 92-54 | 1 | 27 | 2 | 3 | 5 | 4 | 4 | 1.0 | 0 | 0 | 1 | 0 |
| Feb 16 | Saint Joseph's College of Maine | L, 75-49 | 1 | 26 | 1 | 3 | 4 | 1 | 4 | 0.3 | 1 | 0 | 2 | - |
| Feb 18 | at Clark University | L, 67-39 | 1 | 22 | 2 | 1 | 3 | 0 | 3 | 0.0 | 1 | 2 | 0 | 0 |
| Feb 20 | Johnson & Wales (RI) | L, 69-35 | 1 | 20 | 1 | 3 | 4 | 2 | 5 | 0.4 | 0 | 0 | 2 | 0 |
| gp | gs | min/g | fg/g | pct | 3pt/g | pct | ft/g | pct | ppg | |
|---|---|---|---|---|---|---|---|---|---|---|
| 2013-14 | 22 | 22 | 25.9 | 3.5-9.0 | 38.2 | 0.0-0.5 | 10.0 | 2.0-3.4 | 58.7 | 9.0 |
| 2014-15 | 24 | 21 | 24.4 | 4.1-10.7 | 38.3 | 0.0-0.2 | 16.7 | 2.5-3.5 | 73.5 | 10.8 |
| 2015-16 | 25 | 18 | 24.0 | 2.2-7.7 | 28.0 | 0.0-0.3 | 0.0 | 2.1-2.8 | 73.2 | 6.4 |
| 2016-17 | 24 | 19 | 27.6 | 4.1-10.4 | 39.6 | 0.1-0.5 | 18.2 | 4.0-5.2 | 77.4 | 12.3 |
| Total | 95 | 80 | 25.4 | 3.4-9.5 | 36.4 | 0.0-0.4 | 11.8 | 2.7-3.7 | 71.7 | 9.6 |
| gp | gs | min | fg | pct | 3pt | pct | ft | pct | pts | |
|---|---|---|---|---|---|---|---|---|---|---|
| 2013-14 | 22 | 22 | 570 | 76-199 | 38.2 | 1-10 | 10.0 | 44-75 | 58.7 | 197 |
| 2014-15 | 24 | 21 | 585 | 98-256 | 38.3 | 1-6 | 16.7 | 61-83 | 73.5 | 258 |
| 2015-16 | 25 | 18 | 599 | 54-193 | 28.0 | 0-7 | 0.0 | 52-71 | 73.2 | 160 |
| 2016-17 | 24 | 19 | 662 | 99-250 | 39.6 | 2-11 | 18.2 | 96-124 | 77.4 | 296 |
| Total | 95 | 80 | 2416 | 327-898 | 36.4 | 4-34 | 11.8 | 253-353 | 71.7 | 911 |
| gp | gs | min/g | fg/40 | pct | 3pt/40 | pct | ft/40 | pct | pts/40 | |
|---|---|---|---|---|---|---|---|---|---|---|
| 2013-14 | 22 | 22 | 25.9 | 5.3-14.0 | 38.2 | 0.1-0.7 | 10.0 | 3.1-5.3 | 58.7 | 13.8 |
| 2014-15 | 24 | 21 | 24.4 | 6.7-17.5 | 38.3 | 0.1-0.4 | 16.7 | 4.2-5.7 | 73.5 | 17.6 |
| 2015-16 | 25 | 18 | 24.0 | 3.6-12.9 | 28.0 | 0.0-0.5 | 0.0 | 3.5-4.7 | 73.2 | 10.7 |
| 2016-17 | 24 | 19 | 27.6 | 6.0-15.1 | 39.6 | 0.1-0.7 | 18.2 | 5.8-7.5 | 77.4 | 17.9 |
| Total | 95 | 80 | 25.4 | 5.4-14.9 | 36.4 | 0.1-0.6 | 11.8 | 4.2-5.8 | 71.7 | 15.1 |
| gp | gs | mpg | off/g | def/g | reb/g | pf/g | dq/g | ast/g | to/g | a/to | stl/g | blk/g | |
|---|---|---|---|---|---|---|---|---|---|---|---|---|---|
| 2013-14 | 22 | 22 | 25.9 | 2.3 | 4.0 | 6.3 | 2.9 | 0.0 | 0.5 | 2.4 | 0.2 | 0.6 | 0.5 |
| 2014-15 | 24 | 21 | 24.4 | 2.2 | 5.3 | 7.5 | 2.5 | 0.0 | 0.7 | 3.0 | 0.2 | 0.7 | 0.6 |
| 2015-16 | 25 | 18 | 24.0 | 1.5 | 3.5 | 5.0 | 1.5 | 0.0 | 1.3 | 2.2 | 0.6 | 0.8 | 0.8 |
| 2016-17 | 24 | 19 | 27.6 | 3.0 | 5.4 | 8.4 | 2.2 | 0.0 | 1.0 | 2.3 | 0.4 | 0.9 | 0.9 |
| Total | 95 | 80 | 25.4 | 2.2 | 4.5 | 6.8 | 2.3 | 0.0 | 0.9 | 2.4 | 0.4 | 0.8 | 0.7 |
| gp | gs | mpg | off/40 | def/40 | reb/40 | pf/40 | dq/40 | ast/40 | to/40 | a/to | stl/40 | blk/40 | |
|---|---|---|---|---|---|---|---|---|---|---|---|---|---|
| 2013-14 | 22 | 22 | 25.9 | 3.5 | 6.2 | 9.8 | 4.4 | 0.1 | 0.8 | 3.7 | 0.2 | 1.0 | 0.8 |
| 2014-15 | 24 | 21 | 24.4 | 3.6 | 8.7 | 12.3 | 4.2 | 0.1 | 1.2 | 4.9 | 0.2 | 1.2 | 1.0 |
| 2015-16 | 25 | 18 | 24.0 | 2.5 | 5.8 | 8.3 | 2.5 | 0.0 | 2.1 | 3.6 | 0.6 | 1.3 | 1.4 |
| 2016-17 | 24 | 19 | 27.6 | 4.4 | 7.8 | 12.2 | 3.2 | 0.0 | 1.5 | 3.3 | 0.4 | 1.3 | 1.3 |
| Total | 95 | 80 | 25.4 | 3.5 | 7.2 | 10.7 | 3.5 | 0.0 | 1.4 | 3.8 | 0.4 | 1.2 | 1.1 |
| gp | gs | min/g | fg/g | pct | 3pt/g | pct | ft/g | pct | ppg | |
|---|---|---|---|---|---|---|---|---|---|---|
| Total | 25 | 18 | 24.0 | 2.2-7.7 | 28.0 | 0.0-0.3 | 0.0 | 2.1-2.8 | 73.2 | 6.4 |
| Conference | 11 | 11 | 26.5 | 2.5-8.8 | 27.8 | 0.0-0.2 | 0.0 | 2.7-3.6 | 75.0 | 7.6 |
| Exhibition | - | - | - | 0.0-0.0 | - | 0.0-0.0 | - | 0.0-0.0 | - | - |
- | ||||||||||
| Home | 12 | 10 | 25.2 | 2.2-8.0 | 27.1 | 0.0-0.3 | 0.0 | 2.1-2.6 | 80.6 | 6.4 |
| Away | 13 | 8 | 22.8 | 2.2-7.5 | 28.9 | 0.0-0.2 | 0.0 | 2.1-3.1 | 67.5 | 6.4 |
| Neutral | - | - | - | 0.0-0.0 | - | 0.0-0.0 | - | 0.0-0.0 | - | - |
- | ||||||||||
| Wins | 7 | 4 | 22.0 | 2.4-7.7 | 31.5 | 0.0-0.3 | 0.0 | 1.6-1.9 | 84.6 | 6.4 |
| Losses | 18 | 14 | 24.7 | 2.1-7.7 | 26.6 | 0.0-0.3 | 0.0 | 2.3-3.2 | 70.7 | 6.4 |
- | ||||||||||
| November | 3 | - | 22.7 | 2.0-7.3 | 27.3 | 0.0-0.3 | 0.0 | 1.3-2.0 | 66.7 | 5.3 |
| December | 4 | - | 17.3 | 2.2-6.2 | 36.0 | 0.0-0.0 | - | 0.8-1.2 | 60.0 | 5.3 |
| January | 11 | 11 | 26.3 | 2.4-8.4 | 28.3 | 0.0-0.3 | 0.0 | 1.6-2.4 | 69.2 | 6.4 |
| February | 7 | 7 | 24.7 | 1.9-7.7 | 24.1 | 0.0-0.4 | 0.0 | 3.9-4.9 | 79.4 | 7.6 |
| gp | gs | min | fg | pct | 3pt | pct | ft | pct | pts | |
|---|---|---|---|---|---|---|---|---|---|---|
| Total | 25 | 18 | 599 | 54-193 | 28.0 | 0-7 | 0.0 | 52-71 | 73.2 | 160 |
| Conference | 11 | 11 | 292 | 27-97 | 27.8 | 0-2 | 0.0 | 30-40 | 75.0 | 84 |
| Exhibition | - | - | - | 0-0 | - | 0-0 | - | 0-0 | - | 0 |
- | ||||||||||
| Home | 12 | 10 | 302 | 26-96 | 27.1 | 0-4 | 0.0 | 25-31 | 80.6 | 77 |
| Away | 13 | 8 | 297 | 28-97 | 28.9 | 0-3 | 0.0 | 27-40 | 67.5 | 83 |
| Neutral | - | - | - | 0-0 | - | 0-0 | - | 0-0 | - | 0 |
- | ||||||||||
| Wins | 7 | 4 | 154 | 17-54 | 31.5 | 0-2 | 0.0 | 11-13 | 84.6 | 45 |
| Losses | 18 | 14 | 445 | 37-139 | 26.6 | 0-5 | 0.0 | 41-58 | 70.7 | 115 |
- | ||||||||||
| November | 3 | - | 68 | 6-22 | 27.3 | 0-1 | 0.0 | 4-6 | 66.7 | 16 |
| December | 4 | - | 69 | 9-25 | 36.0 | 0-0 | - | 3-5 | 60.0 | 21 |
| January | 11 | 11 | 289 | 26-92 | 28.3 | 0-3 | 0.0 | 18-26 | 69.2 | 70 |
| February | 7 | 7 | 173 | 13-54 | 24.1 | 0-3 | 0.0 | 27-34 | 79.4 | 53 |
| gp | gs | min/g | fg/40 | pct | 3pt/40 | pct | ft/40 | pct | pts/40 | |
|---|---|---|---|---|---|---|---|---|---|---|
| Total | 25 | 18 | 24.0 | 3.6-12.9 | 28.0 | 0.0-0.5 | 0.0 | 3.5-4.7 | 73.2 | 10.7 |
| Conference | 11 | 11 | 26.5 | 3.7-13.3 | 27.8 | 0.0-0.3 | 0.0 | 4.1-5.5 | 75.0 | 11.5 |
| Exhibition | - | - | - | 0.0-0.0 | - | 0.0-0.0 | - | 0.0-0.0 | - | - |
- | ||||||||||
| Home | 12 | 10 | 25.2 | 3.4-12.7 | 27.1 | 0.0-0.5 | 0.0 | 3.3-4.1 | 80.6 | 10.2 |
| Away | 13 | 8 | 22.8 | 3.8-13.1 | 28.9 | 0.0-0.4 | 0.0 | 3.6-5.4 | 67.5 | 11.2 |
| Neutral | - | - | - | 0.0-0.0 | - | 0.0-0.0 | - | 0.0-0.0 | - | - |
- | ||||||||||
| Wins | 7 | 4 | 22.0 | 4.4-14.0 | 31.5 | 0.0-0.5 | 0.0 | 2.9-3.4 | 84.6 | 11.7 |
| Losses | 18 | 14 | 24.7 | 3.3-12.5 | 26.6 | 0.0-0.4 | 0.0 | 3.7-5.2 | 70.7 | 10.3 |
- | ||||||||||
| November | 3 | - | 22.7 | 3.5-12.9 | 27.3 | 0.0-0.6 | 0.0 | 2.4-3.5 | 66.7 | 9.4 |
| December | 4 | - | 17.3 | 5.2-14.5 | 36.0 | 0.0-0.0 | - | 1.7-2.9 | 60.0 | 12.2 |
| January | 11 | 11 | 26.3 | 3.6-12.7 | 28.3 | 0.0-0.4 | 0.0 | 2.5-3.6 | 69.2 | 9.7 |
| February | 7 | 7 | 24.7 | 3.0-12.5 | 24.1 | 0.0-0.7 | 0.0 | 6.2-7.9 | 79.4 | 12.3 |
| gp | gs | mpg | off/g | def/g | reb/g | pf/g | dq/g | ast/g | to/g | a/to | stl/g | blk/g | |
|---|---|---|---|---|---|---|---|---|---|---|---|---|---|
| Total | 25 | 18 | 24.0 | 1.5 | 3.5 | 5.0 | 1.5 | 0.0 | 1.3 | 2.2 | 0.6 | 0.8 | 0.8 |
| Conference | 11 | 11 | 26.5 | 1.2 | 3.5 | 4.7 | 1.7 | 0.0 | 1.7 | 2.5 | 0.7 | 0.7 | 0.5 |
| Exhibition | - | - | - | - | - | - | - | - | - | - | - | - | - |
- | |||||||||||||
| Home | 12 | 10 | 25.2 | 1.3 | 4.1 | 5.3 | 1.3 | 0.0 | 1.5 | 2.2 | 0.7 | 0.7 | 0.7 |
| Away | 13 | 8 | 22.8 | 1.7 | 2.9 | 4.6 | 1.6 | 0.0 | 1.1 | 2.2 | 0.5 | 0.9 | 1.0 |
| Neutral | - | - | - | - | - | - | - | - | - | - | - | - | - |
- | |||||||||||||
| Wins | 7 | 4 | 22.0 | 1.3 | 4.3 | 5.6 | 0.9 | - | 1.0 | 1.9 | 0.5 | 0.4 | 1.3 |
| Losses | 18 | 14 | 24.7 | 1.6 | 3.2 | 4.7 | 1.7 | 0.0 | 1.4 | 2.3 | 0.6 | 0.9 | 0.7 |
- | |||||||||||||
| November | 3 | - | 22.7 | 2.7 | 2.3 | 5.0 | 1.3 | - | 0.3 | 2.0 | 0.2 | 0.0 | 1.7 |
| December | 4 | - | 17.3 | 1.3 | 2.5 | 3.8 | 2.3 | 0.0 | 0.3 | 1.0 | 0.3 | 1.0 | 1.0 |
| January | 11 | 11 | 26.3 | 0.7 | 4.5 | 5.3 | 1.5 | 0.0 | 1.5 | 1.8 | 0.8 | 0.9 | 0.8 |
| February | 7 | 7 | 24.7 | 2.3 | 2.9 | 5.1 | 1.1 | 0.0 | 1.9 | 3.4 | 0.5 | 0.9 | 0.4 |
| gp | gs | min | off | def | reb | pf | dq | ast | to | a/to | stl | blk | |
|---|---|---|---|---|---|---|---|---|---|---|---|---|---|
| Total | 25 | 18 | 599 | 37 | 87 | 124 | 37 | 0 | 32 | 54 | 0.6 | 20 | 21 |
| Conference | 11 | 11 | 292 | 13 | 39 | 52 | 19 | 0 | 19 | 27 | 0.7 | 8 | 5 |
| Exhibition | - | - | - | - | - | - | - | - | - | - | - | - | - |
- | |||||||||||||
| Home | 12 | 10 | 302 | 15 | 49 | 64 | 16 | 0 | 18 | 26 | 0.7 | 8 | 8 |
| Away | 13 | 8 | 297 | 22 | 38 | 60 | 21 | 0 | 14 | 28 | 0.5 | 12 | 13 |
| Neutral | - | - | - | - | - | - | - | - | - | - | - | - | - |
- | |||||||||||||
| Wins | 7 | 4 | 154 | 9 | 30 | 39 | 6 | - | 7 | 13 | 0.5 | 3 | 9 |
| Losses | 18 | 14 | 445 | 28 | 57 | 85 | 31 | 0 | 25 | 41 | 0.6 | 17 | 12 |
- | |||||||||||||
| November | 3 | - | 68 | 8 | 7 | 15 | 4 | - | 1 | 6 | 0.2 | 0 | 5 |
| December | 4 | - | 69 | 5 | 10 | 15 | 9 | 0 | 1 | 4 | 0.3 | 4 | 4 |
| January | 11 | 11 | 289 | 8 | 50 | 58 | 16 | 0 | 17 | 20 | 0.8 | 10 | 9 |
| February | 7 | 7 | 173 | 16 | 20 | 36 | 8 | 0 | 13 | 24 | 0.5 | 6 | 3 |
| gp | gs | mpg | off/40 | def/40 | reb/40 | pf/40 | dq/40 | ast/40 | to/40 | a/to | stl/40 | blk/40 | |
|---|---|---|---|---|---|---|---|---|---|---|---|---|---|
| Total | 25 | 18 | 24.0 | 2.5 | 5.8 | 8.3 | 2.5 | 0.0 | 2.1 | 3.6 | 0.6 | 1.3 | 1.4 |
| Conference | 11 | 11 | 26.5 | 1.8 | 5.3 | 7.1 | 2.6 | 0.0 | 2.6 | 3.7 | 0.7 | 1.1 | 0.7 |
| Exhibition | - | - | - | - | - | - | - | - | - | - | - | - | - |
- | |||||||||||||
| Home | 12 | 10 | 25.2 | 2.0 | 6.5 | 8.5 | 2.1 | 0.0 | 2.4 | 3.4 | 0.7 | 1.1 | 1.1 |
| Away | 13 | 8 | 22.8 | 3.0 | 5.1 | 8.1 | 2.8 | 0.0 | 1.9 | 3.8 | 0.5 | 1.6 | 1.8 |
| Neutral | - | - | - | - | - | - | - | - | - | - | - | - | - |
- | |||||||||||||
| Wins | 7 | 4 | 22.0 | 2.3 | 7.8 | 10.1 | 1.6 | 0.0 | 1.8 | 3.4 | 0.5 | 0.8 | 2.3 |
| Losses | 18 | 14 | 24.7 | 2.5 | 5.1 | 7.6 | 2.8 | 0.0 | 2.2 | 3.7 | 0.6 | 1.5 | 1.1 |
- | |||||||||||||
| November | 3 | - | 22.7 | 4.7 | 4.1 | 8.8 | 2.4 | 0.0 | 0.6 | 3.5 | 0.2 | 0.0 | 2.9 |
| December | 4 | - | 17.3 | 2.9 | 5.8 | 8.7 | 5.2 | 0.0 | 0.6 | 2.3 | 0.3 | 2.3 | 2.3 |
| January | 11 | 11 | 26.3 | 1.1 | 6.9 | 8.0 | 2.2 | 0.0 | 2.4 | 2.8 | 0.8 | 1.4 | 1.2 |
| February | 7 | 7 | 24.7 | 3.7 | 4.6 | 8.3 | 1.8 | 0.0 | 3.0 | 5.5 | 0.5 | 1.4 | 0.7 |